Make a microscopic simulation
In the two following models, individuals are seen as spherical particles. They move at a desired velocity to reach a goal (typically a door). Doing nothing more would lead to many overlaps between individuals. Hence the two families of models below can prevent these overlaps through two different approaches. For the Social Force models, and, for some forces are added to act against overlaps, and for the Granular model the velocities are projected into a permissible velocity space which ensures the absence of overlaps.
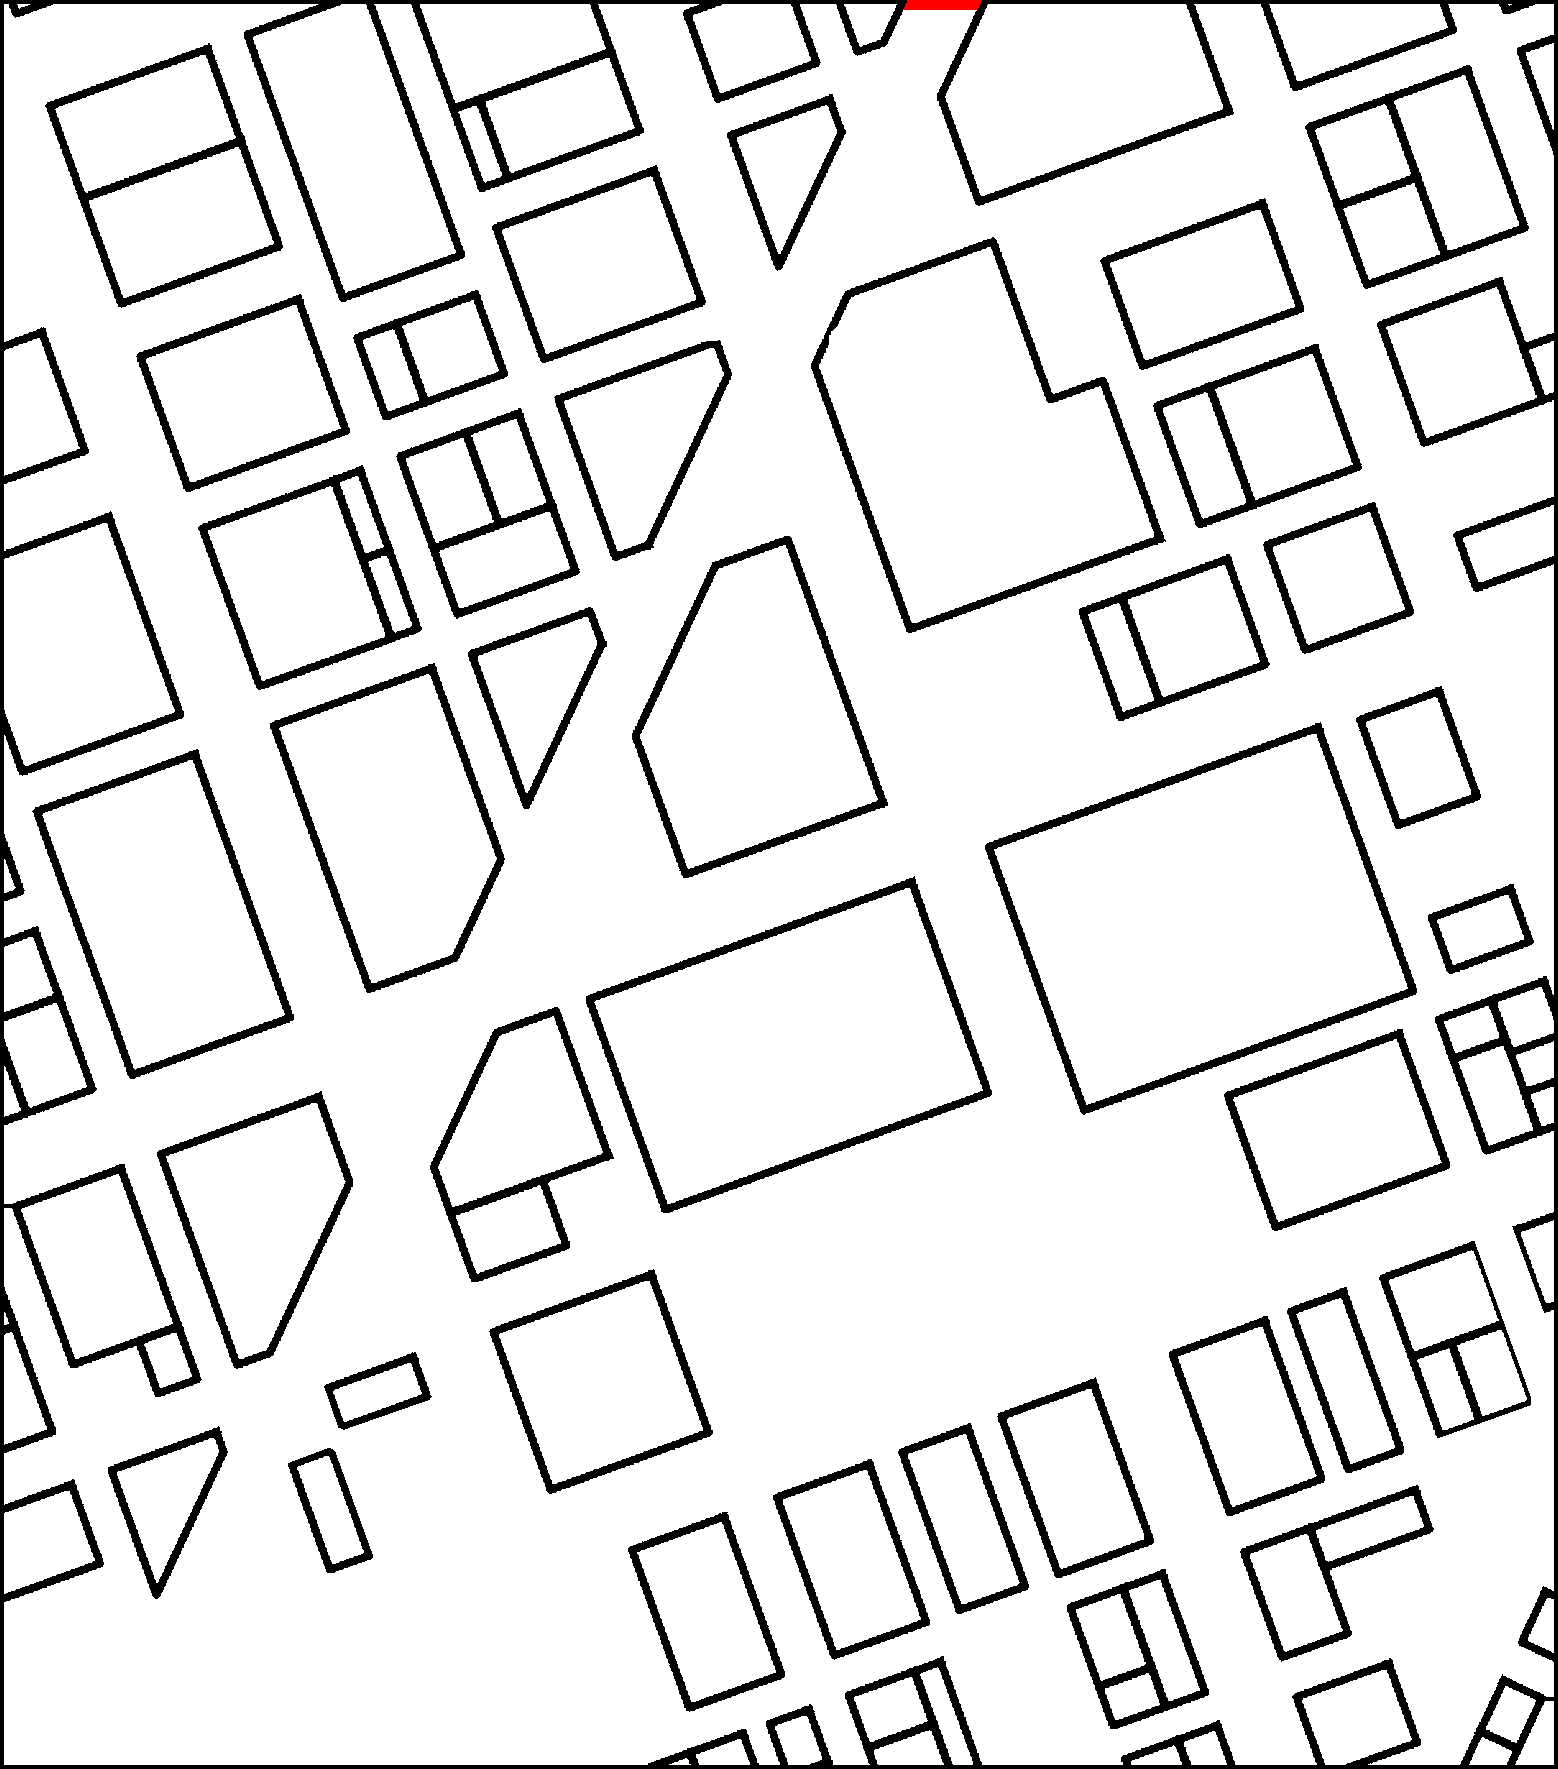
The domain used for both models is obtained by using the following background image:
Granular model
The Granular model comes from crowd motion models of the granular type : each individual is identified to a hard disk of a prescribed size, subject to a non-overlapping constraint with their neighbors. The approach relies on a desired velocity for each individual (the velocity they would take if they were alone), and the global velocity field shall be defined as the closest to the desired one among all those feasible fields (fields which do not lead to overlapping of disks).
Reference : [MF2018] Chapter 4.
An example can be find in the directory
cromosim/examples/micro/granular
and can be launched with
python3 micro_granular.py --json input.json
# Authors:
# Sylvain Faure <sylvain.faure@math.u-psud.fr>
# Bertrand Maury <bertrand.maury@math.u-psud.fr>
#
# cromosim/examples/micro/granular/micro_granular.py
# python micro_granular.py --json input.json
#
# License: GPL
import sys, os
from cromosim import *
from cromosim.micro import *
from optparse import OptionParser
import json
plt.ion()
"""
python3 micro_granular.py --json input.json
"""
parser = OptionParser(usage="usage: %prog [options] filename",version="%prog 1.0")
parser.add_option('--json',dest="jsonfilename",default="input.json",type="string",
action="store",help="Input json filename")
opt, remainder = parser.parse_args()
print("===> JSON filename = ",opt.jsonfilename)
with open(opt.jsonfilename) as json_file:
input = json.load(json_file)
"""
Get parameters from json file :
name: string
Domain name
prefix: string
Folder name to store the results
background: string
Image file used as background
px: float
Pixel size in meters (also called space step)
width: integer
Domain width (equal to the width of the background image)
height: integer
Domain height (equal to the height of the background image)
wall_lines : list of numpy arrays
Polylines used to build walls, [ [[x0,x1,x2,...],[y0,y1,y2,...]],... ]
wall_ellipses : list of numpy arrays
Ellipses used to build walls, [ [x_center,y_center, width, height, \
angle_in_degrees_anti-clockwise],... ]
wall_polygons : list of numpy arrays
Polygons used to build walls, [ [[x0,x1,x2,...],[y0,y1,y2,...]],... ]
wall_lines : list of numpy arrays
Polylines used to build walls, [ [[x0,x1,x2,...],[y0,y1,y2,...]],... ]
door_lines: list of numpy arrays
Polylines used to build doors, [ [[x0,x1,x2,...],[y0,y1,y2,...]],... ]
seed: integer
Random seed which can be used to reproduce a random selection if >0
rmin: float
Minimum radius for people
rmax: float
Maximum radius for people
N: list
Number of persons in each boxes
init_people_box: list
List of boxes to randomly position people at initialization, \
[[xmin,xmax,ymin,ymax],...]
exit_people_box:
People outside this box will be deleted, [xmin,xmax,ymin,ymax]
Tf: float
Final time
dt: float
Time step
drawper: integer
The results will be displayed every "drawper" iterations
dmax: float
Maximum distance used to detect neighbors
dmin: float
Minimum distance allowed between individuals
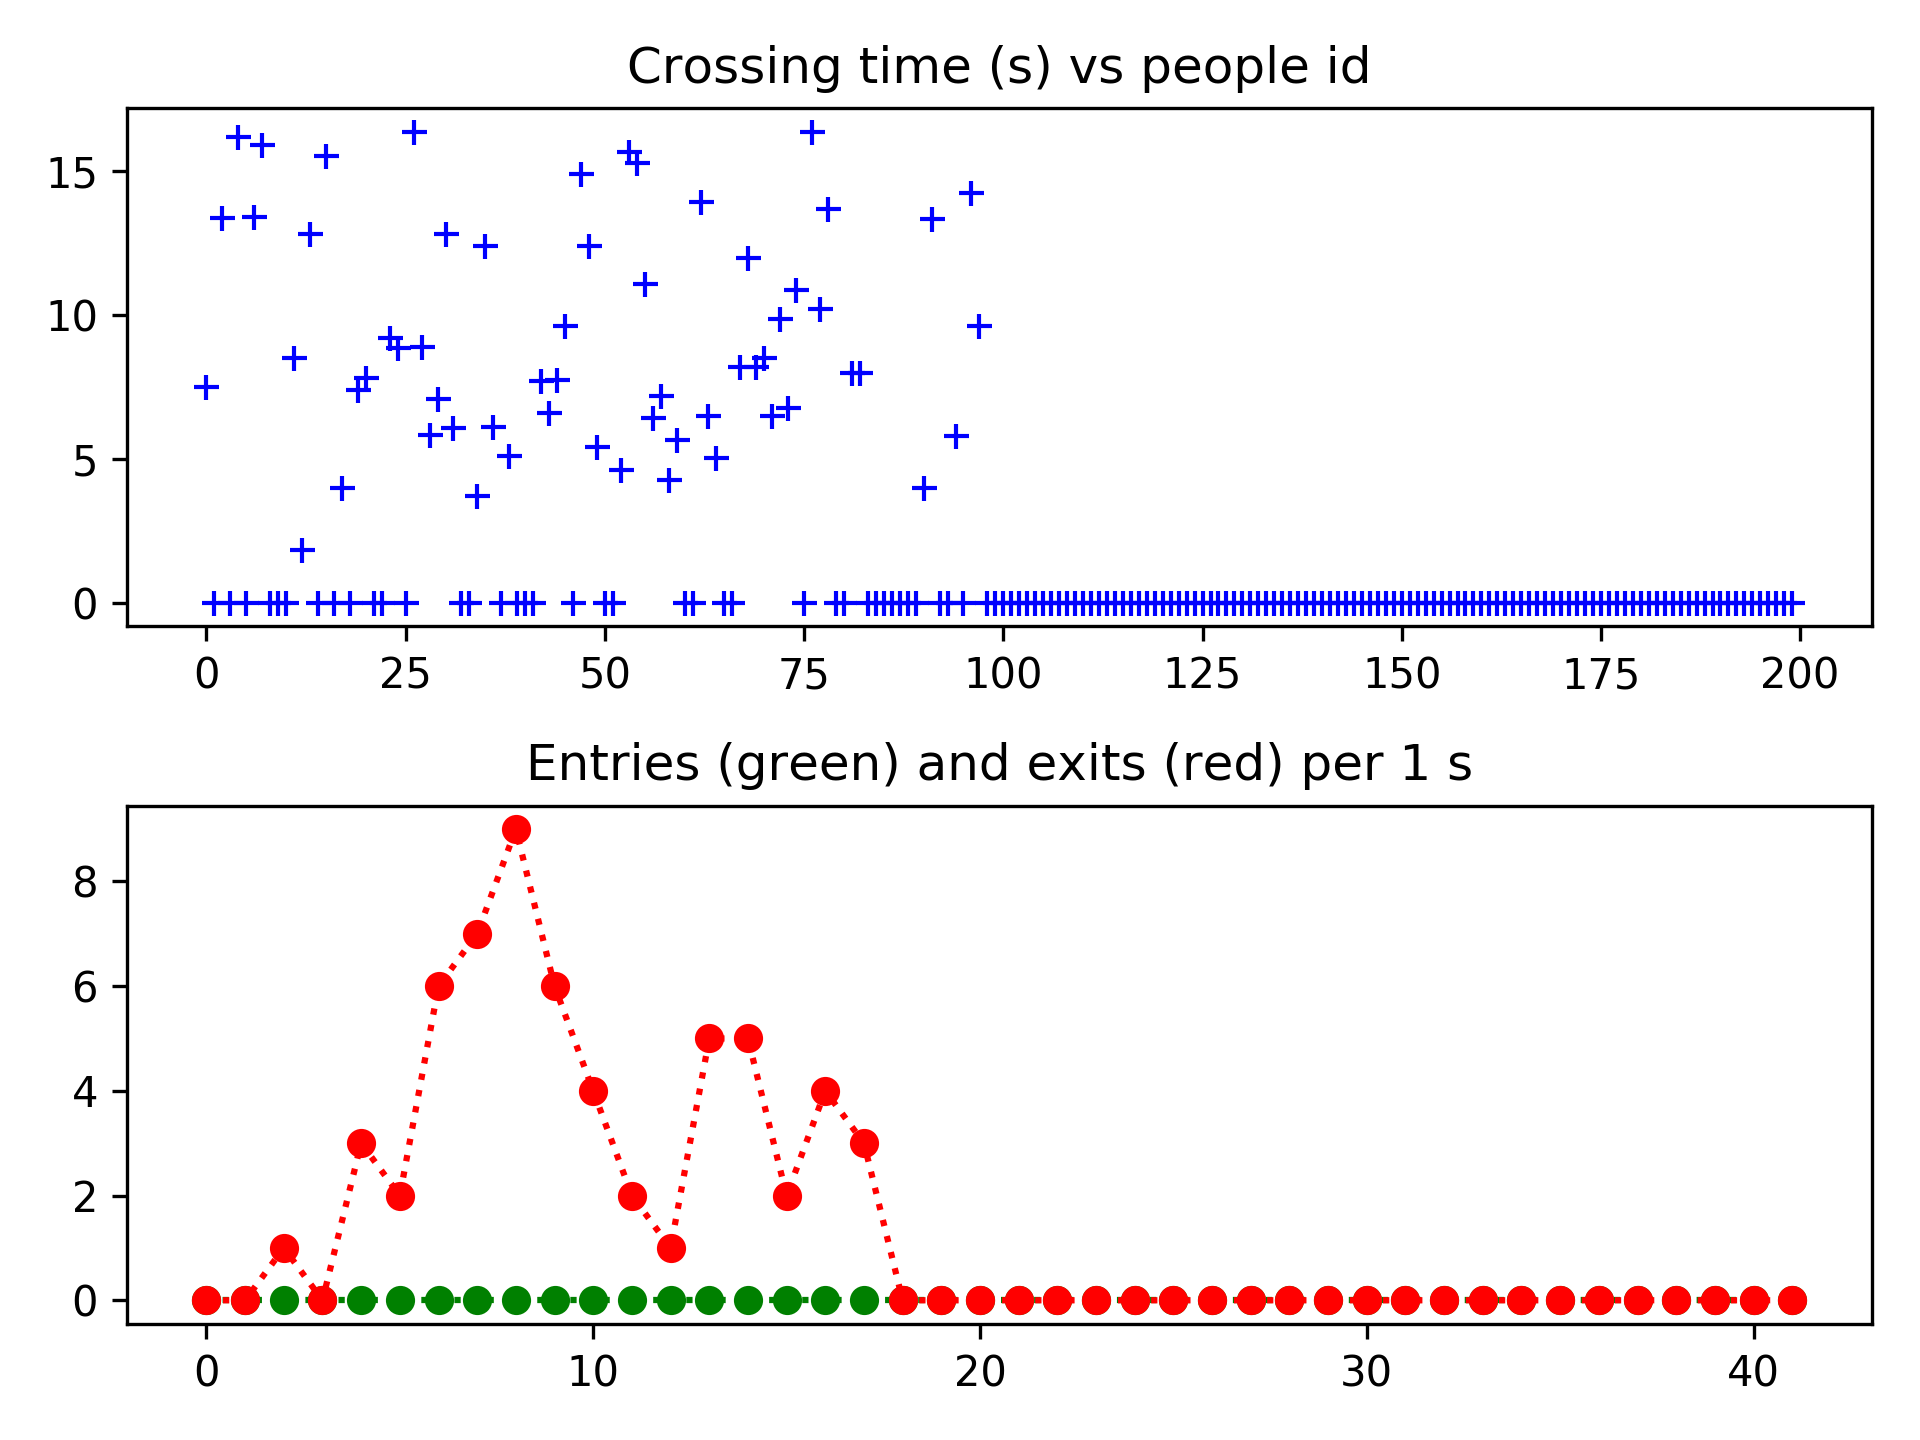
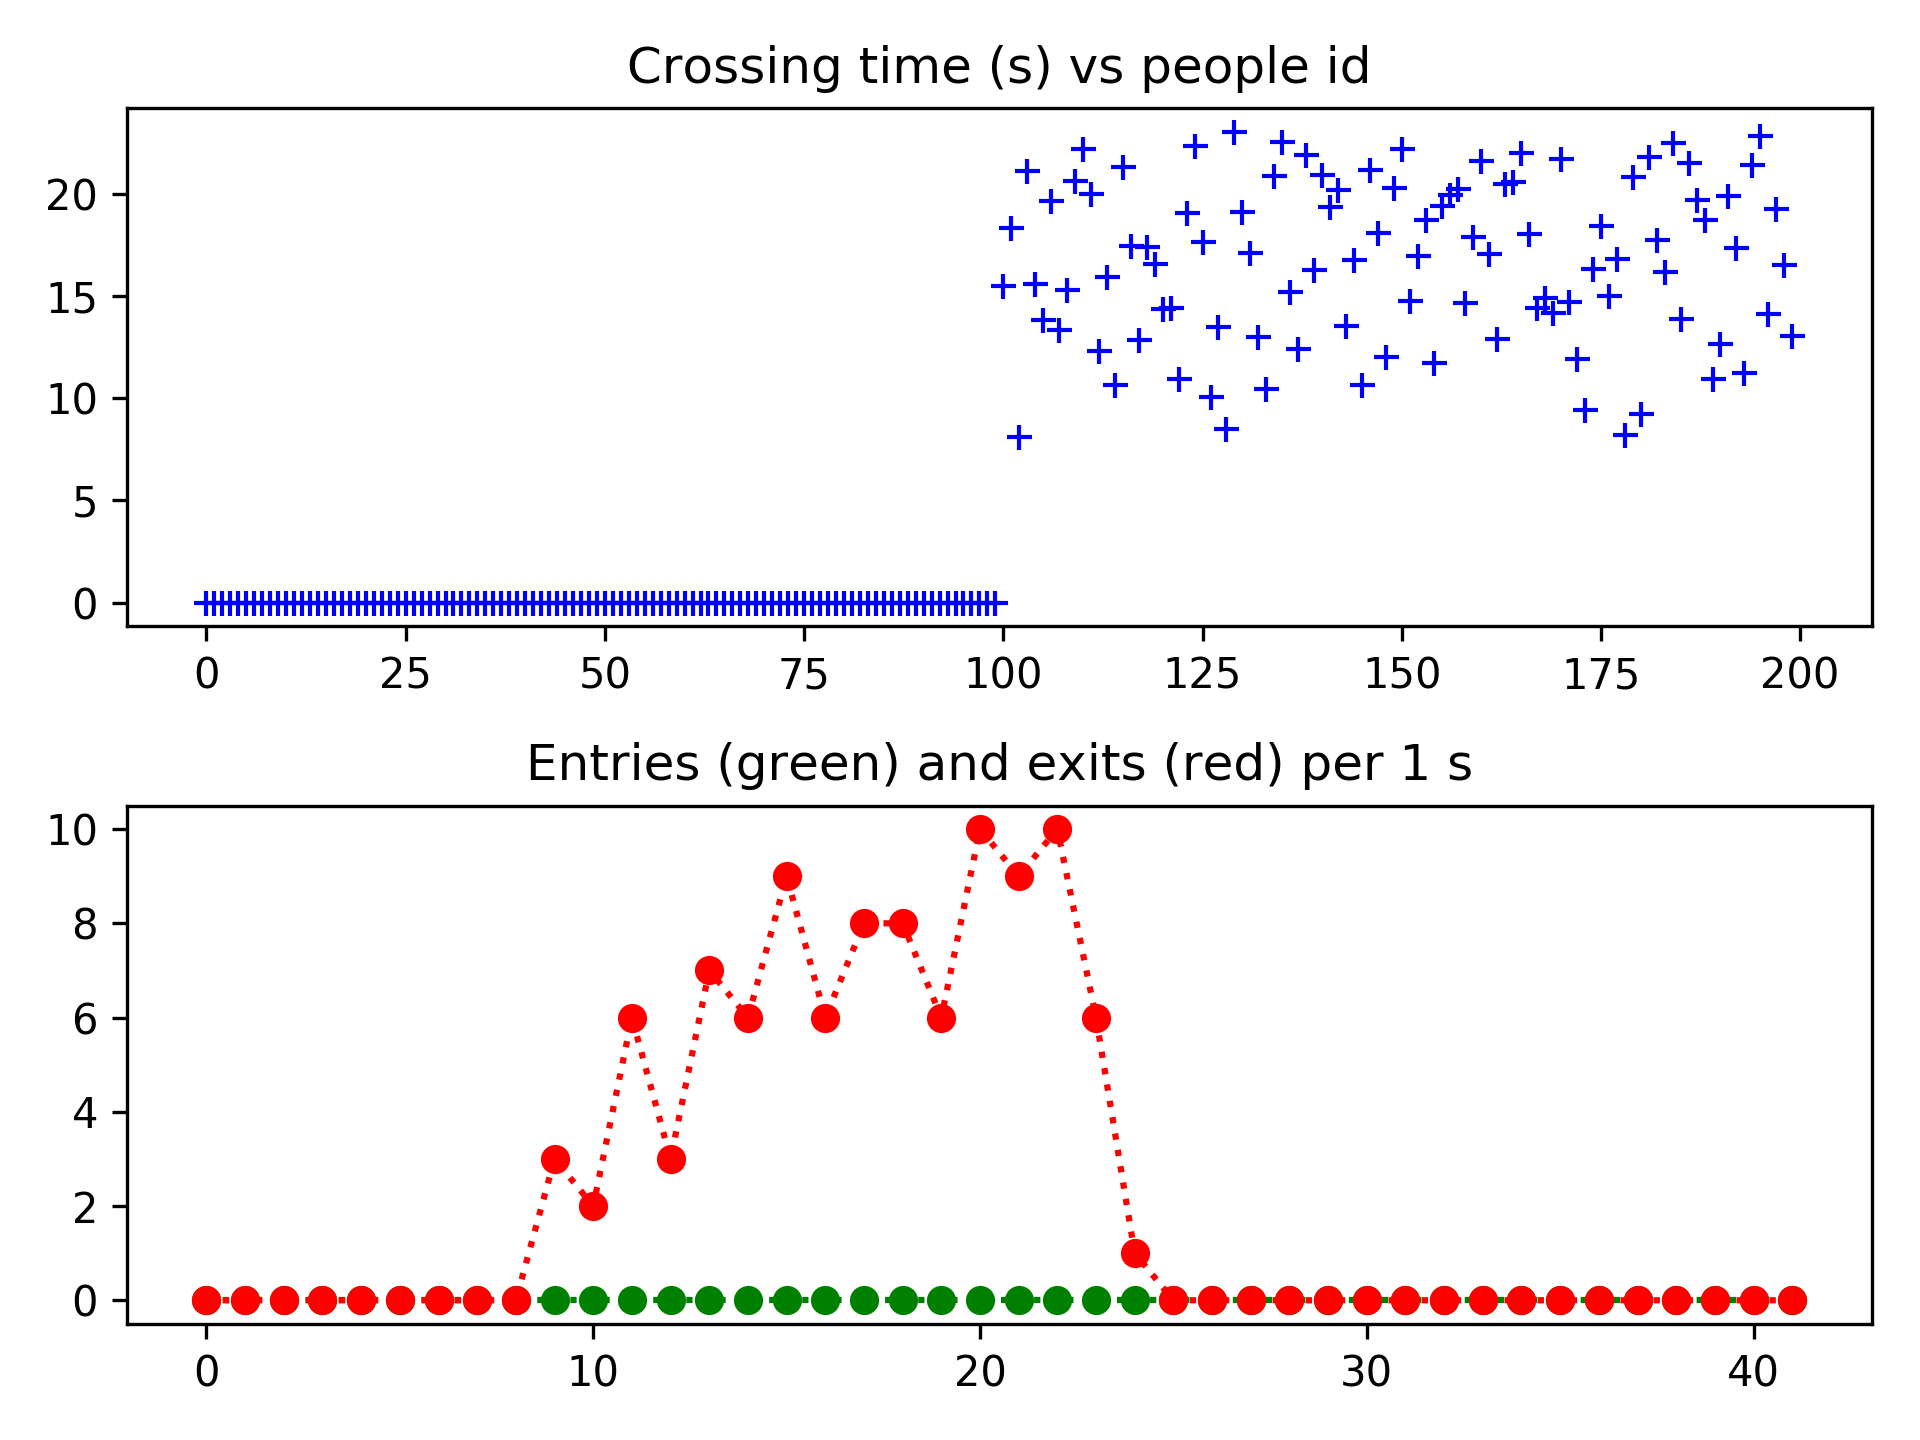
sensors: list of numpy array
Segments through which incoming and outgoing flows are measured
[ [x0,y0,x1,y1],... ]
plot_people: boolean
If true, people are drawn
plot_contacts: boolean
If true, active contacts between people are drawn
plot_velocities: boolean
If true, people velocities are drawn
plot_paths: boolean
If true, people paths are drawn
plot_sensors: boolean
If true, plot sensor lines on people graph and sensor data graph
"""
name = input["name"]
prefix = input["prefix"]
if not os.path.exists(prefix):
os.makedirs(prefix)
background = input["background"]
px = input["px"]
width = input["width"]
height = input["height"]
wall_lines = input["wall_lines"]
wall_ellipses = input["wall_ellipses"]
wall_polygons = input["wall_polygons"]
door_lines = input["door_lines"]
seed = input["seed"]
N = sp.array(input["N"]).astype(int)
print("N = ",N)
Np = N.sum()
rmin = input["rmin"]
rmax = input["rmax"]
init_people_box = sp.array(input["init_people_box"])
exit_people_box = input["exit_people_box"]
Tf = input["Tf"]
dt = input["dt"]
drawper = input["drawper"]
dmax = input["dmax"]
dmin = input["dmin"]
sensors = input["sensors"]
plot_p = input["plot_people"]
plot_c = input["plot_contacts"]
plot_v = input["plot_velocities"]
plot_pa = input["plot_paths"]
plot_s = input["plot_sensors"]
print("===> Number of persons = ",Np)
print("===> Final time, Tf = ",Tf)
print("===> Time step, dt = ",dt)
print("===> To draw the results each drawper iterations, drawper = ",drawper)
print("===> Maximal distance to find neighbors, dmax = ",dmax,", example : 2*dt")
print("===> Minimal distance between persons, dmin = ",dmin)
"""
Build the Domain
"""
## To create an Domain object
if (background==""):
dom = Domain(name=name, pixel_size=px, width=width, height=height)
else:
dom = Domain(name=name, background=background, pixel_size=px)
## To add lines : Line2D(xdata, ydata, linewidth)
for xy in wall_lines:
line = Line2D( xy[0],xy[1], linewidth=8)
dom.add_wall(line)
## To add ellipses : Ellipse( (x_center,y_center), width, height,
## angle_in_degrees_anti-clockwise )
for e in wall_ellipses:
ellipse = Ellipse( (e[0], e[1]), e[2], e[3], e[4])
dom.add_wall(ellipse)
## To add polygons : Polygon( xy )
for p in wall_polygons:
polygon = Polygon(p)
dom.add_wall(polygon)
## To add doors :
for xy in door_lines:
line = Line2D( xy[0],xy[1], linewidth=8)
dom.add_door(line)
## To build the domain : background + shapes
dom.build_domain()
## To compute the distance to the walls
dom.compute_wall_distance()
## To compute the desired velocity
dom.compute_desired_velocity()
## To show the domain dimensions
print("===> Domain : ",dom)
print("===> Wall lines : ",wall_lines)
print("===> Door lines : ",door_lines)
#plt.ioff()
#dom.plot(id=1)
#dom.plot_desired_velocity(id=2)
#plt.show()
"""
Initialization
"""
## Current time
t = 0.0
people, people_init_box_id, rng = people_initialization(N, init_people_box, dom,
dt, rmin, rmax, dmin=dmin,
seed=seed)
## Array to store the results : all the people coordinates for all times
Np = people.shape[0]
Np_init = Np
people_id = sp.arange(Np)
results = sp.copy(people[:,:2]).reshape((Np,2,1))
## Array to store sensor data : time dir pts[2] for each sensor line
if (len(sensors)>0):
sensor_data = sp.zeros((Np,4,len(sensors)))
"""
Main loop
"""
cc = 0
counter = 0
while (t<Tf):
contacts = compute_contacts(dom, people, dmax)
I, J, Vd = compute_desired_velocity(dom, people)
if ((cc>=drawper) or (counter==0)):
print("===> time = ",t," number of persons = ",Np)
plot_people(10, dom, people, contacts, Vd, people[:,2], time=t,
plot_people=plot_p, plot_contacts=plot_c,
plot_velocities=plot_v, plot_paths=plot_pa,paths=results,
plot_sensors=plot_s, sensors=sensors,
savefig=True, filename=prefix+'fig_'+ \
str(counter).zfill(6)+'.png')
plt.pause(0.01)
# if (t>0):
# for i, s in enumerate(sensors):
# plot_sensor_data(30+i, sensor_data[:,:,i], t, savefig=True,
# filename=prefix+'sensor_'+str(i)+'_'+str(counter)+'.png')
# plt.pause(0.01)
cc = 0
info, B, U, L, P = projection(dt, people, contacts, Vd, dmin = dmin)
if (len(sensors)>0):
people, io_id, io_times, io_dir, io_pts = move_people(t, dt, people, U,
crosslines=sensors)
## Store sensor data
for i,s in enumerate(io_id):
ss = people_id[s]
if (s.shape[0]>0):
sensor_data[ss,0,i] = io_times[i]
sensor_data[ss,1,i] = io_dir[i]
sensor_data[ss,2,i] = io_pts[i][:,0]
sensor_data[ss,3,i] = io_pts[i][:,1]
else:
people = move_people(t, dt, people, U)
people, U, [people_id] = exit_door(2*dom.pixel_size, dom, people, U,
arrays=[ people_id])
Np = people.shape[0]
if (Np == 0):
print("END... Nobody here !")
break
## Store people positions in the result array (used to draw people paths)
tmp = 1e99*sp.ones((Np_init,2))
tmp[people_id,:] = people[:,:2]
results = sp.concatenate((results,tmp.reshape((Np_init,2,1))), axis=2)
t += dt
cc += 1
counter += 1
if (len(sensors)>0):
for i, s in enumerate(sensors):
plot_sensor_data(30+i, sensor_data[:,:,i], t, savefig=True,
filename=prefix+'sensor_'+str(i)+'_'+str(counter)+'.png')
plt.pause(0.01)
plt.ioff()
plt.show()
sys.exit()
Social force model
The Social Force model has been introduced in the 90’s. Pedestrians are identified with inertial particles submitted to a forcing term which implements the individual tendencies and extra forces which account for interactions with other pedestrians (typically the tendency to preserve a certain distance with neighbors).
Reference : [MF2018] Chapter 3.
An example can be found in the directory
and can be launched with